Transport network project in French West Africa
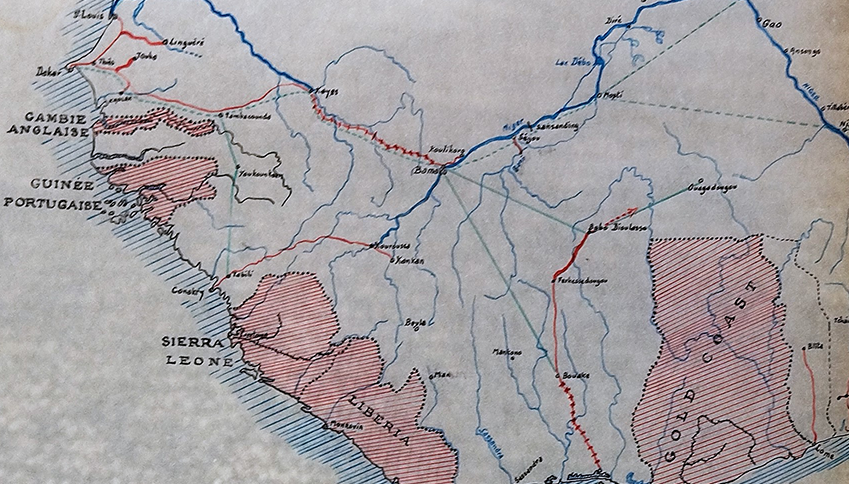
BNP Paribas’ archives hold records from French West Africa (FWA), where the forerunner banks of the Group invested in the 1930s.
On the basis of a schematic transport map and four graphs, let’s take a look at a project for a privately-managed public transport authority (régie co-intéressée des transports) in FWA, an organisation created to control and coordinate all rail, road and river communications in the region.
Recorded in 1943, the genesis of the project dates back to 1931, when the Banque de Paris et des Pays-Bas (Paribas) became involved. However, national political events and the Second World War prevented it from being put into action at the time.
This article is adapted from an article in the journal Flux, Cahiers Scientifiques Internationaux Réseaux et Territoires, Gustave Eiffel University, issue 135-136 (January-March 2024/1) revue-flux.cairn.info
Fluctuations in the types of traffic across all transport networks in FWA from 1929 to 1939
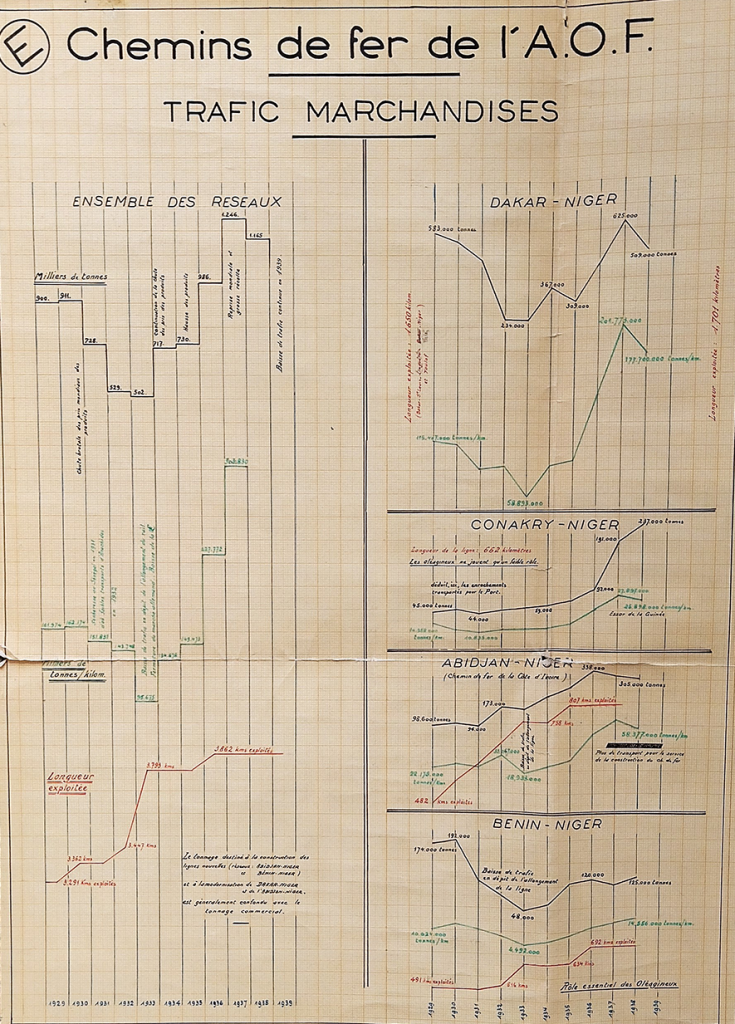
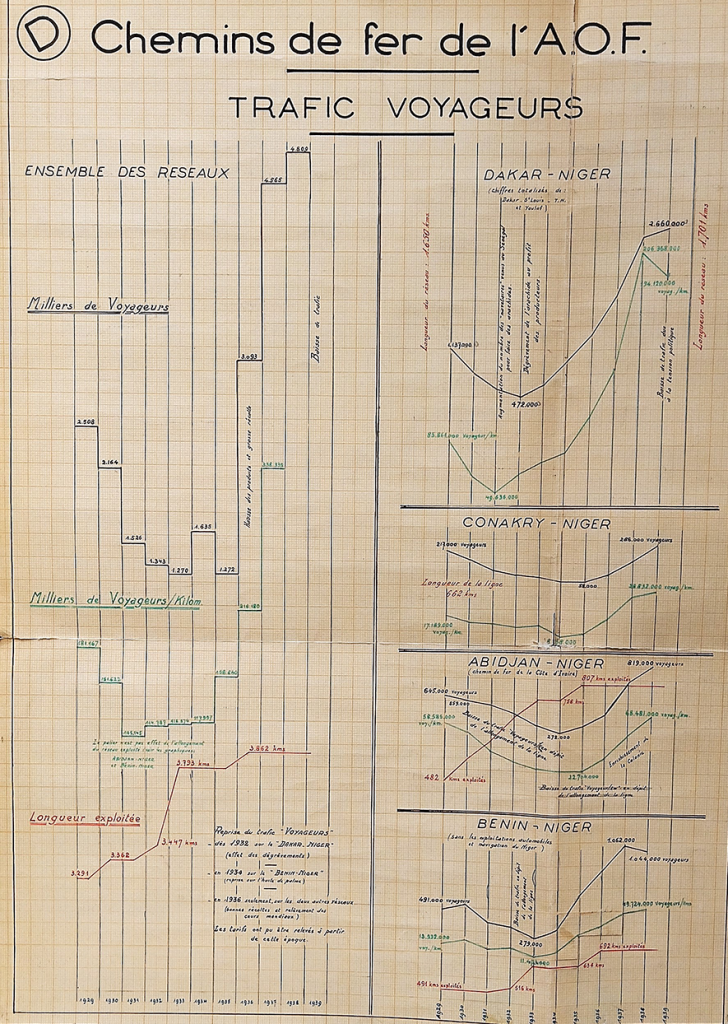
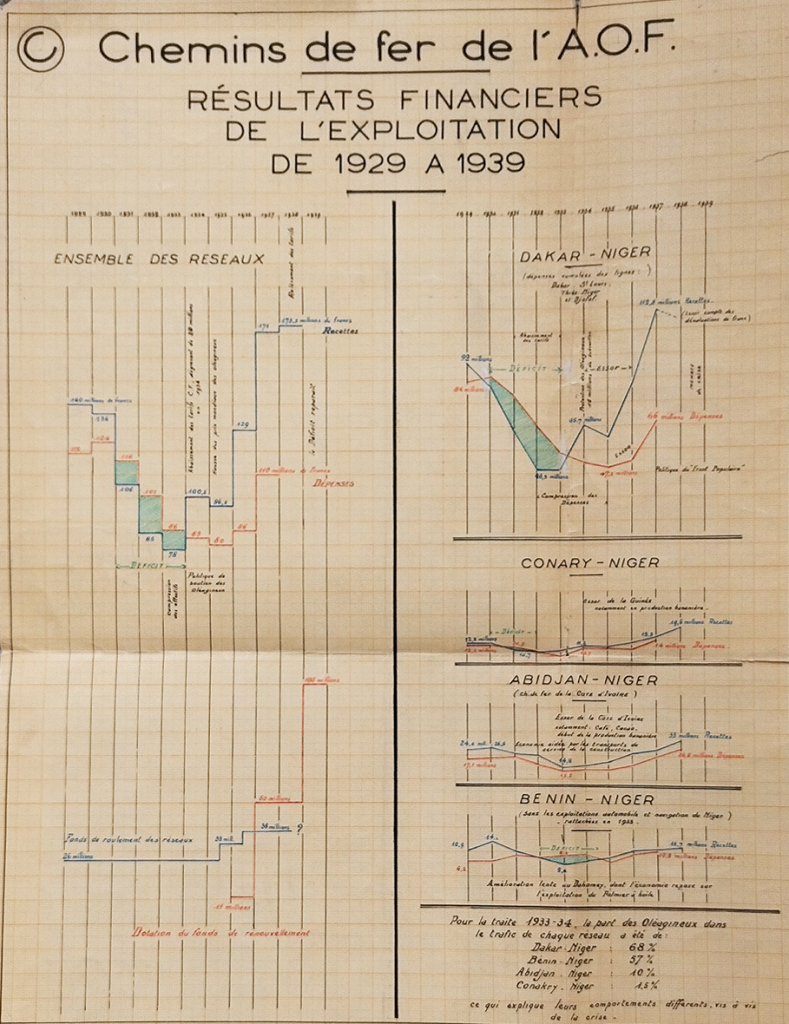
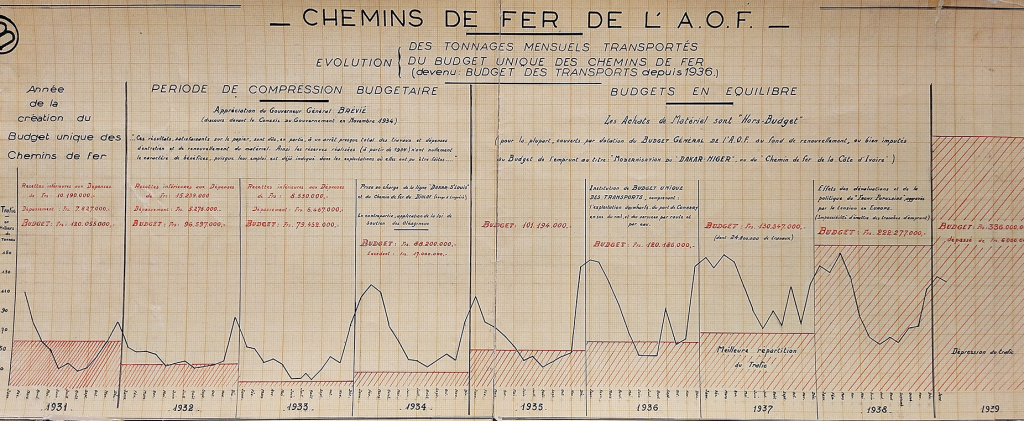
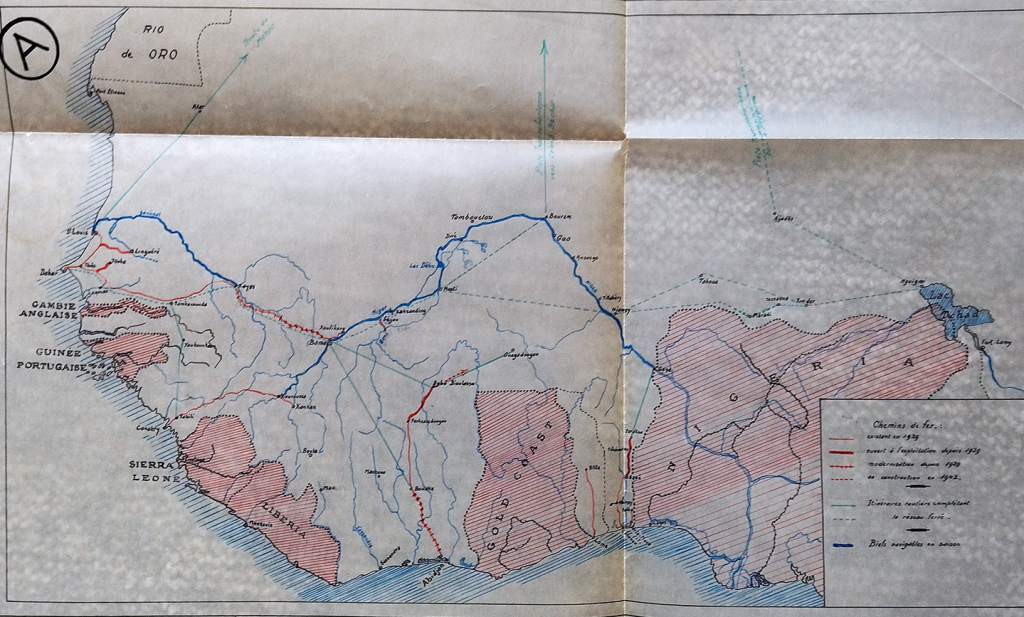
BNP Paribas Historical Archives, 21CABET126: note on the privately-managed public authority project in French West Africa, 1929-1939
The privately-managed public authority project
This data visualisation of statistical surveys of transport operations in FWA between 1929 and 1939 aimed to revive a project that was by then 10 years old, having been approved in 1934 but then shelved due to the election of the Popular Front in 1936.
DID YOU KNOW?
It was at the turn of the 20th century that the practice of data visualisation of statistical data – the ancestor of Excel graphs – was widely adopted by administrations and engineers. This marked a move from flow data to economic data, modelling social, urban, demographic, climatological and other aspects. It was also around this time that companies and the business community seized on “graphic semiology” as a decision-making tool: by visually organising a series of statistical data, the human brain appropriates the figures, which become more accessible and tangible, thereby facilitating the analysis of the data presented. This therefore allowed figures to serve a defined objective.
In 1932, at the request of the General Government of FWA, a group of shareholders, including Paribas, had planned to put in place a management agreement in order to modernise the FWA rail network, which was operated by France. The plan was revived in 1943 with a view to preparing for the post-war period: moving from war production to production focused on international markets, so as to move away from dependence on the mother country. It was proposed to reorganise the FWA railways under public administration, in order to streamline operation of the network and improve the results of the loss-making Dakar-Niger line. This involved deploying a Mediterranean-Niger network, also focused on the Sudanese regions and Algeria. Infrastructure and superstructure works were planned to adapt them to the required level of traffic and significantly expand their scale.
The first use of graphic visualisation is credited to Charles-Joseph Minard, an engineer from Ponts et Chaussées. From the mid-1850s, the engineers of Ponts et Chaussées used graphs – documents widely used for economic intelligence purposes in the colonies in Asia and China – to estimate the work they needed to carry out and the equipment required. This was used to collect, then rationalise, map and visualise large amounts of statistical information. At the time, these graphical representations were used to support statistical findings, with the aim of providing the administration with an effective tool to improve infrastructure in France, including inland waterway navigation, freight traffic and rail traffic.
The FWA railway network
The highly disparate FWA railway network – consisting of metric-track lines – stretched over 3,860km in 1941. Its lines, which were isolated from one another and poorly managed, had been designed and built by military personnel in the late 19th century. Consisting mainly of military routes penetrating the interior of the country from the coast and used to export products, Niger was at the centre of this transport system. The very low-density network did not include any branch lines linking the main coast-interior lines, which all converged on a single country, Niger.
Supporting the region’s economic development
Between 1932 and 1943, the economy of FWA changed profoundly, with the development of oilseed production, and as the region became an exporter of coffee, bananas (Guinea and Côte d’Ivoire), cocoa (Côte d’Ivoire), palm oil (Dahomey, present-day Benin) and livestock. These developments called for a complete overhaul of the region’s transport systems by better distributing shipments of goods and reorganising their storage during stopovers.
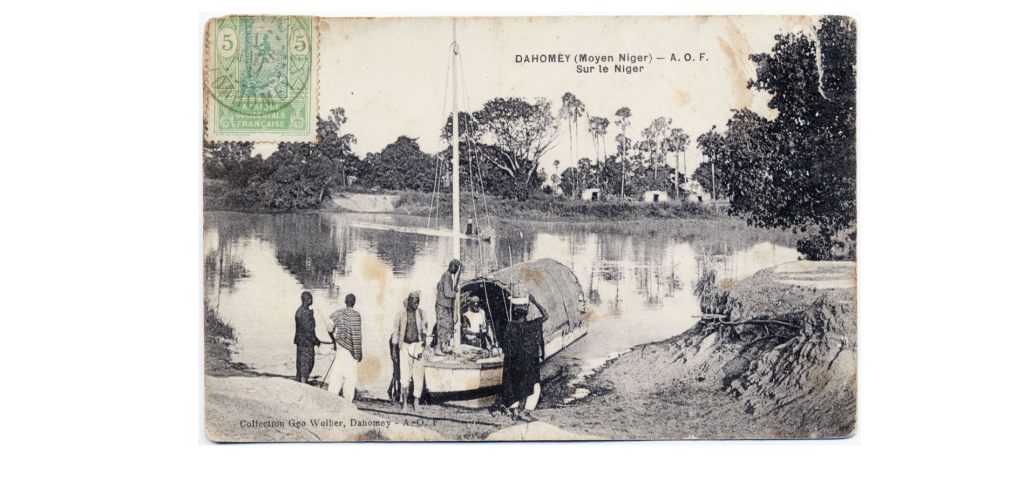
Dakar (Senegal) seemed the ideal point, with 4,500km of network in place and centralisation of all services. This was done by taking the Bamako-Dakar line and linking part of it via the Guinea railway to the nearest port at Conakry, and via the future Ségou-Bobo Dioulasso section, which at the time was the terminus of the Côte d’Ivoire line, but which would be extended to the future port of Abidjan. Similarly, the Dahomey railway would be extended to Malenville on Niger.
The aim of the project discussed in 1934 and 1943 was to make the region an economic player on world markets. This provided a response to the post-war needs of the countries affected by the project as well as to the territories in the FWA region. The proposed solution supported competitiveness, with the aim of retaining and gaining market share by reducing transport costs through a single body managing those transport routes. Ultimately, the development and restructuring of the railway network addressed the key question of the development of West Africa.


